
Jupyter Notebookでpgm imageを表示させる方法ということで、先ずはこのサイトから拝借した下記のコードを実行してpgm画像を作成する。
#! /usr/bin/env python
#
import numpy as np
import pycuda.autoinit
import pycuda.driver as drv
import pycuda.gpuarray as gpuarray
import pycuda.tools

#from pgma_io import pgma_write
from pycuda.compiler import SourceModule
from pycuda.elementwise import ElementwiseKernel
#
#  Define the kernel function: ( "arguments", """text""", name=name ).
#
complex_gpu = ElementwiseKernel(
  "float xmin, float xmax, float ymin, float ymax, int xnum, int ynum, int count_max, int *count_gpu",
  """
    float ci;
    int col;
    float cr;
    int k;
    int row;
    float zi;
    float zi_new;
    float znormsq;
    float zr;
    float zr_new;
//
//  I, the value of the 1-dimensional thread index, is automatically supplied.
//
    col = i % xnum;
    row = i / xnum;
    cr = ( ( xnum - col - 1 ) * xmin + col * xmax ) / ( xnum - 1 );
    ci = ( ( ynum - row - 1 ) * ymax + row * ymin ) / ( ynum - 1 );
    count_gpu[i] = count_max;
    zr = 0.0;
    zi = 0.0;
    for ( k = 0; k < count_max; k++ )
    {
      zr_new = zr * zr - zi * zi + cr;
      zi_new = 2.0 * zr * zi + ci;
      zi = zi_new;
      zr = zr_new;

      znormsq = zr * zr + zi * zi;
      if ( 4.0 <= znormsq )
      {
        count_gpu[i] = k;
        break;
      }
    }
  """,
  name = "mandlebrot_gpu"
)
def mandelbrot_pycuda ( ):

  print ( '' )
  print ( 'MANDELBROT_PYCUDA:' )
  print ( '  PyCUDA version' )
  print ( '  Compute the Mandelbrot set and save it in a graphics file.' )

  xmin = -2.0
  xmax = 1.0
  ymin = -1.25
  ymax = 1.25
  xnum = 1000
  ynum = 1000
  count_max = 250

  print ( '' )
  print ( '  X range: [ %g, %g ]' % ( xmin, xmax ) )
  print ( '  Y range: [ %g, %g ]' % ( ymin, ymax ) )
  print ( '  Xnum = %d x Ynum = %d = %d Pixels' % ( xnum, ynum, xnum * ynum ) )
  print ( '  Maximum number of iterations = %d' % ( count_max ) )
#
#  Allocate a CPU vector.
#
  count_cpu = np.zeros ( xnum * ynum ).astype ( np.int32 )
#
#  Link it to a vector on the GPU.
#
  count_gpu = gpuarray.to_gpu ( count_cpu )
#
#  Perform the calculation on the GPU.
#
  complex_gpu ( \
    np.float32 ( xmin ), \
    np.float32 ( xmax ), \
    np.float32 ( ymin ), \
    np.float32 ( ymax ), \
    np.int16 ( xnum ), \
    np.int16 ( ynum ), \
    np.int16 ( count_max ), \
    count_gpu )
#
#  Copy the GPU vector to the CPU vector.
#
  count_gpu.get ( count_cpu )
#
#  Reshape the CPU vector to an array.
#
  count_cpu = count_cpu.reshape ( xnum, ynum )
#
#  Save the array as PGM graphics file.
#
  file_name = 'mandelbrot_pycuda.pgm'
  comment = 'mandelbrot_pycuda.pgm'
  %time pgma_write ( file_name, comment, xnum, ynum, count_max, count_cpu )

  print ( '' )
  print ( '  Plot saved in file "%s"' % ( file_name ) )
#
#  Terminate.
#
  print ( '' )
  print ( 'MANDELBROT_PYCUDA:' )
  print ( '  Normal end of execution.' )
  return

def pgma_write ( file_name, comment, width, height, maxval, gray ):

#*****************************************************************************80
#
## PGMA_WRITE writes an ASCII PGM graphics file.
#
#  Licensing:
#
#    This code is distributed under the GNU LGPL license.
#
#  Modified:
#
#    13 May 2017
#
#  Author:
#
#    John Burkardt
#
#  Parameters:
#
#    Input, string FILE_NAME, the name of the file.
#
#    Input, string COMMENT, a comment, which may be empty ('');
#
#    Input, integer WIDTH, HEIGHT, the width and height of the graphics image.
#
#    Input, integer MAXVAL, the maximum allowed gray value.
#
#    Input, integer GRAY[WIDTH,HEIGHT], gray values between 0 and MAXVAL.
#
  file_type = 'P2'

  file_handle = open ( file_name, 'wt' )
  file_handle.write ( "%s\n" % ( file_type ) )
  file_handle.write ( "#%s\n" % ( comment ) )
  file_handle.write ( "%d %d\n" % ( width, height ) )
  file_handle.write ( "%d\n" % ( maxval ) )

  for i in range ( height ):
    for j in range ( width ):
      file_handle.write ( " %d" % ( gray[i,j] ) )
    file_handle.write ( "\n" )

  file_handle.close ( )

  return

if ( __name__ == '__main__' ):
  mandelbrot_pycuda ( )
スポンサーリンク
IPython.display編
IPython.displayが一番手っ取り早い方法だが、残念ながらpgmは扱えない。
from IPython.display import Image, display
display(Image("mandelbrot_pycuda.pgm"))
スポンサーリンク
matplotlib.image編
matplotlib.imageも簡単な方法だが、これもpgmは扱えない。
import matplotlib.pyplot as plt
import matplotlib.image as mpi

img = mpi.imread('mandelbrot_pycuda.pgm')
plt.imshow(img)
plt.show()
スポンサーリンク
PIL.Image編
残念ながらPIL Imageもpgmファイルを扱えない。
from PIL import Image

img = Image.open('mandelbrot_pycuda.pgm')
plt.imshow(img)
plt.show()
スポンサーリンク
opencv編
やはり最後はopencvということで、これだとpgm画像を表示できる。
import numpy as np
import cv2
import matplotlib.pyplot as plt
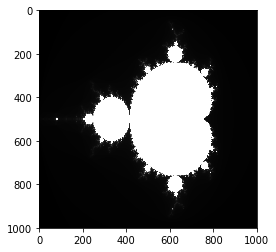
# Load an color image in grayscale
img = cv2.imread('mandelbrot_pycuda.pgm', 1)
plt.imshow(img, cmap='gnuplot2')
plt.show()
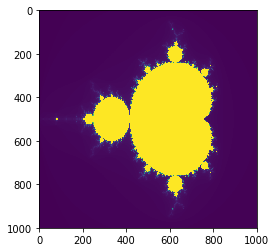
import numpy as np
import cv2
import matplotlib.pyplot as plt

img = cv2.imread('mandelbrot_pycuda.pgm', 0)
plt.imshow(img)
plt.show()
スポンサーリンク