
Stanford University/CS131/Homework1のPart2 cross correlation(相互相関関数)をやる。
# Setup
import numpy as np
import matplotlib.pyplot as plt
from time import time
from skimage import io

from __future__ import print_function

%matplotlib inline
plt.rcParams['figure.figsize'] = 18.0, 14.0 # set default size of plots
plt.rcParams["font.size"] = "18"
plt.rcParams['image.interpolation'] = 'nearest'
plt.rcParams['image.cmap'] = 'gray'
Part 2: Cross-correlation
Cross-correlation of two 2D signals $f$ and $g$ is defined as follows:
$$(f\star{g})[m,n]=\sum_{i=-\infty}^\infty\sum_{j=-\infty}^\infty f[i,j]\cdot g[i-m,j-n]$$
2つの2D信号$f$と$g$の相互相関関数は上記のように表わせる。
Template Matching with Cross-correlation
Suppose that you are a clerk at a grocery store. One of your responsibilites is to check the shelves periodically and stock them up whenever there are sold-out items. You got tired of this laborious task and decided to build a computer vision system that keeps track of the items on the shelf.
スーパーの店員の職務の一つが、定期的に商品棚をチェックして売り切れ商品を棚に補充することである。この面倒な業務に飽きたので、棚の商品を監視し続けるコンピュータービジョンシステムを構築することにしたとしよう。
Luckily, you have learned in CS131 that cross-correlation can be used for template matching: a template $g$ is multiplied with regions of a larger image $f$ to measure how similar each region is to the template.
幸いなことに、相互相関関数が、テンプレート照合に使えることをCS131で学んでいる。テンプレ照合では、テンプレ$g$が、各領域がどれくらいテンプレと類似しているかを測るために、より大きな画像$f$の領域と乗じられる。
The template of a product template.jpg and the image of shelf shelf.jpg is provided. We will use cross-correlation to find the product in the shelf.
商品のテンプレtemplate.jpgと棚の画像shelf.jpgが用意されている。棚の中に商品を探し出すために相互相関関数を使用する。
Implement cross_correlation function in filters.py and run the code below.
filters.pyにcross_correlation関数を実装して下のコードを実行する。
– Hint: you may use the conv_fast function you implemented in the previous question.
Hint:以前の質問で実装したconv_fast関数が使えるかもしれない。
def cross_correlation(f, g):
    """ Cross-correlation of f and g
    Hint: use the conv_fast function defined above.
    Args:
        f: numpy array of shape (Hf, Wf)
        g: numpy array of shape (Hg, Wg)
    Returns:
        out: numpy array of shape (Hf, Wf)
    """
    out = None
    ### YOUR CODE HERE
    g = np.flip(np.flip(g, 0), 1)
    out = conv_faster(f, g)
    ### END YOUR CODE
    return out
from filters import conv_faster
# Load template and image in grayscale
img = io.imread('shelf.jpg')
img_gray = io.imread('shelf.jpg', as_gray=True)
temp = io.imread('template.jpg')
temp_gray = io.imread('template.jpg', as_gray=True)
# Perform cross-correlation between the image and the template
out = cross_correlation(img_gray, temp_gray)
# Find the location with maximum similarity
y,x = (np.unravel_index(out.argmax(), out.shape))
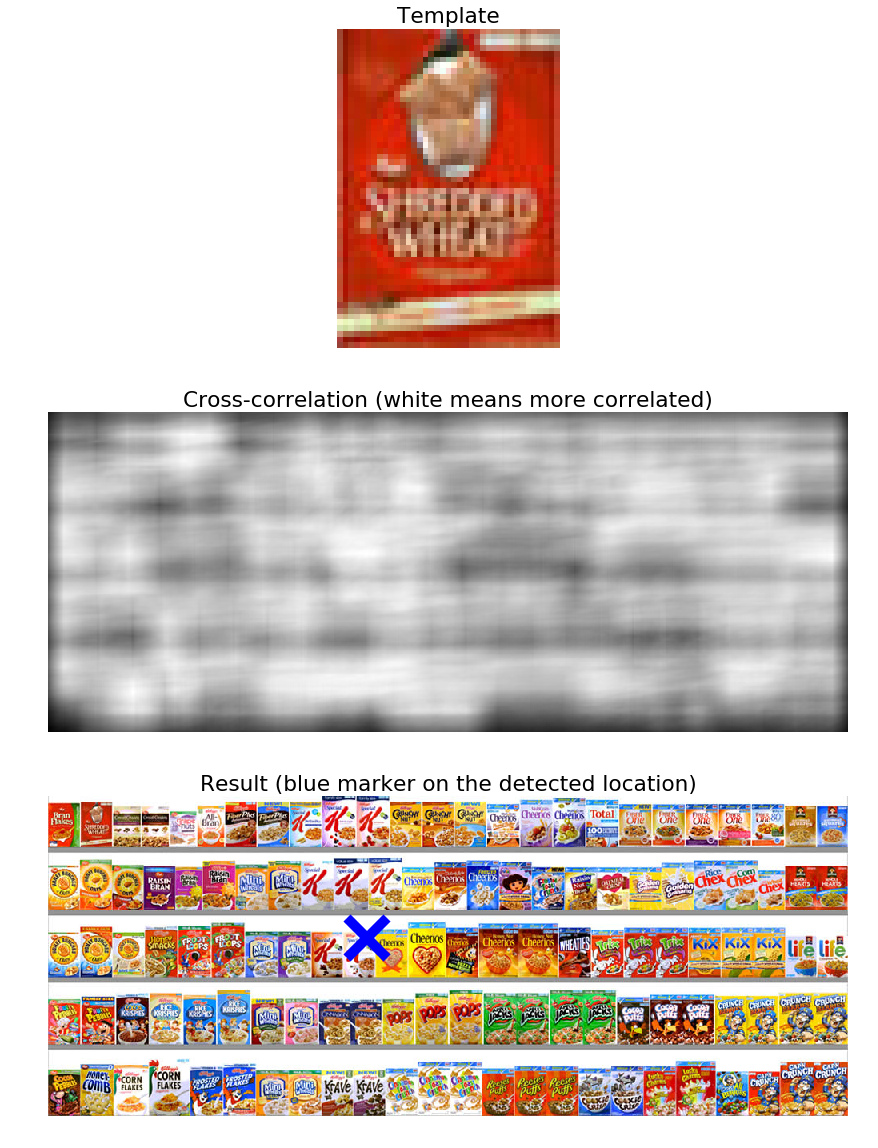
# Display product template
plt.figure(figsize=(25,20))
plt.subplot(3, 1, 1)
plt.imshow(temp)
plt.title('Template')
plt.axis('off')
# Display cross-correlation output
plt.subplot(3, 1, 2)
plt.imshow(out)
plt.title('Cross-correlation (white means more correlated)')
plt.axis('off')
# Display image
plt.subplot(3, 1, 3)
plt.imshow(img)
plt.title('Result (blue marker on the detected location)')
plt.axis('off')
# Draw marker at detected location
plt.plot(x, y, 'bx', ms=40, mew=10)
plt.show()
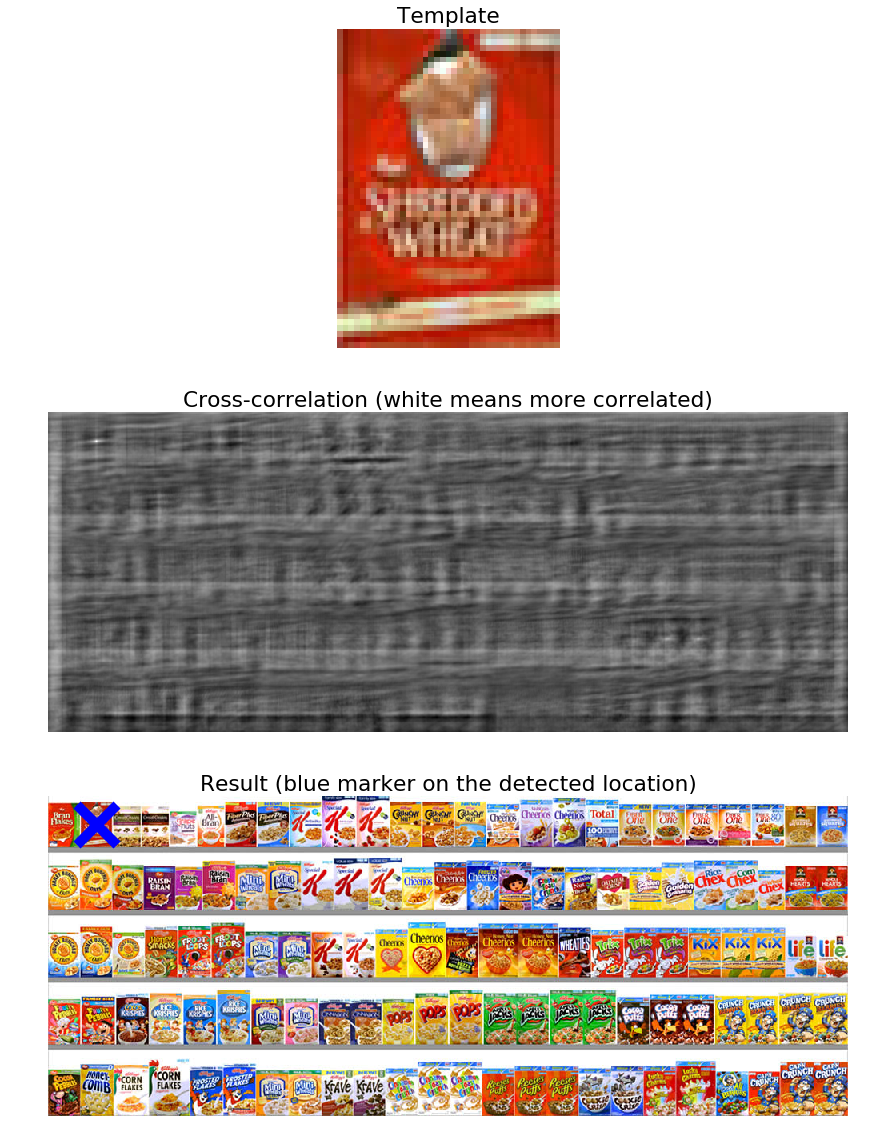
Zero-mean cross-correlation
A solution to this problem is to subtract off the mean value of the template so that it has zero mean.
この問題は、テンプレの平均値をゼロ平均を持つように差し引くことで解ける。
Implement zero_mean_cross_correlation function in filters.py and run the code below.
filters.pyにzero_mean_cross_correlation関数を実装し下のコードを実行する。
def zero_mean_cross_correlation(f, g):
    """ Zero-mean cross-correlation of f and g
    Subtract the mean of g from g so that its mean becomes zero
    Args:
        f: numpy array of shape (Hf, Wf)
        g: numpy array of shape (Hg, Wg)
    Returns:
        out: numpy array of shape (Hf, Wf)
    """
    out = None
    ### YOUR CODE HERE
    g = g - np.mean(g)
    out = cross_correlation(f, g)
    ### END YOUR CODE
    return out
# Perform cross-correlation between the image and the template
out = zero_mean_cross_correlation(img_gray, temp_gray)

# Find the location with maximum similarity
y,x = (np.unravel_index(out.argmax(), out.shape))

# Display product template
plt.figure(figsize=(30,20))
plt.subplot(3, 1, 1)
plt.imshow(temp)
plt.title('Template')
plt.axis('off')

# Display cross-correlation output
plt.subplot(3, 1, 2)
plt.imshow(out)
plt.title('Cross-correlation (white means more correlated)')
plt.axis('off')

# Display image
plt.subplot(3, 1, 3)
plt.imshow(img)
plt.title('Result (blue marker on the detected location)')
plt.axis('off')

# Draw marker at detcted location
plt.plot(x, y, 'bx', ms=40, mew=10)
plt.show()
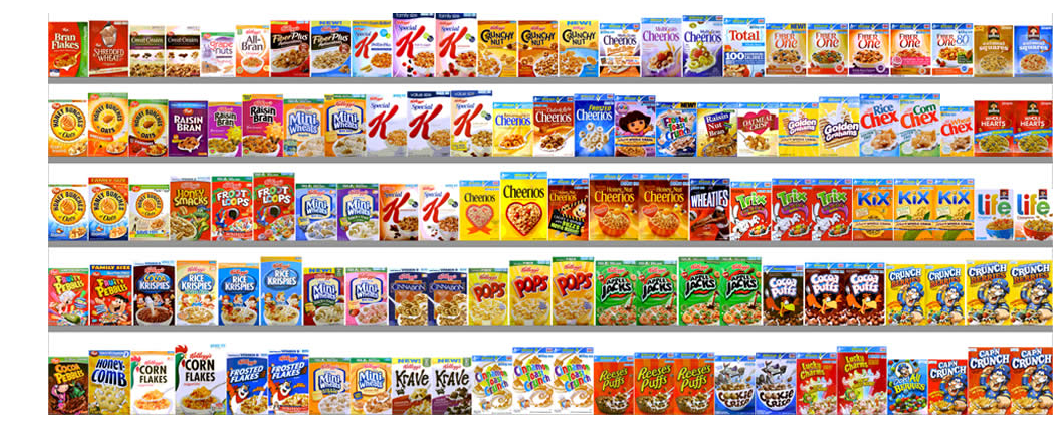
You can also determine whether the product is present with appropriate scaling and thresholding.
商品が適切なスケーリングと閾値を呈するかどうかも確認できる。
def check_product_on_shelf(shelf, product):
out = zero_mean_cross_correlation(shelf, product)
# Scale output by the size of the template
out = out / float(product.shape[0]*product.shape[1])
# Threshold output (this is arbitrary, you would need to tune the threshold for a real application)
out = out > 0.025
if np.sum(out) > 0:
print('The product is on the shelf')
else:
print('The product is not on the shelf')
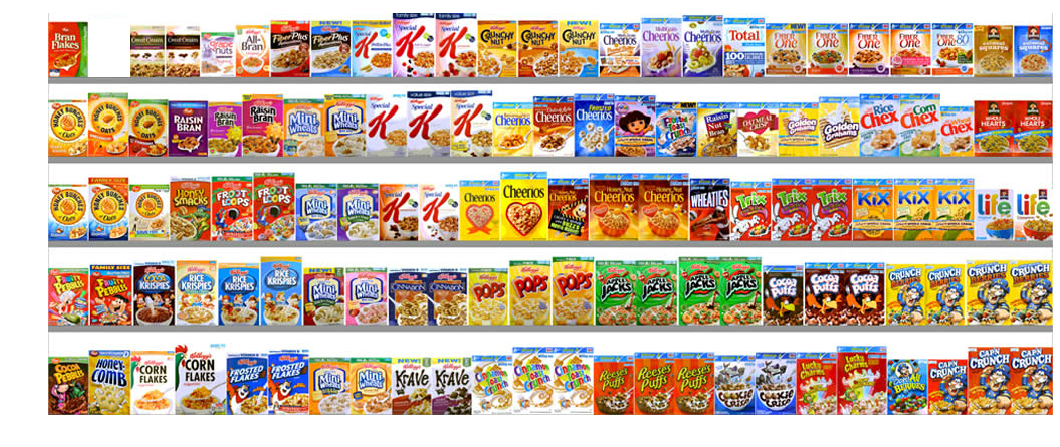
# Load image of the shelf without the product
img2 = io.imread('shelf_soldout.jpg')
img2_gray = io.imread('shelf_soldout.jpg', as_gray=True)
plt.imshow(img)
plt.axis('off')
plt.show()
check_product_on_shelf(img_gray, temp_gray)
plt.imshow(img2)
plt.axis('off')
plt.show()
check_product_on_shelf(img2_gray, temp_gray)
Normalized Cross-correlation
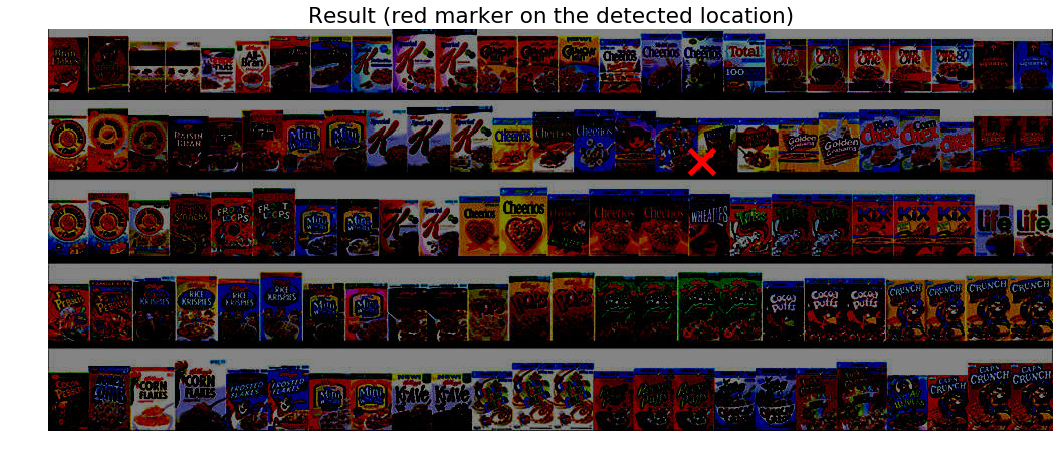
One day the light near the shelf goes out and the product tracker starts to malfunction. The zero_mean_cross_correlation is not robust to change in lighting condition. The code below demonstrates this.
照明が消え商品監視装置が誤動作。zero_mean_cross_correlationは、照明状況の変化に脆い。下のコードがこのことを実証する。
# Load image
img = io.imread('shelf_dark.jpg')
img_gray = io.imread('shelf_dark.jpg', as_gray=True)

# Perform cross-correlation between the image and the template
out = zero_mean_cross_correlation(img_gray, temp_gray)

# Find the location with maximum similarity
y,x = (np.unravel_index(out.argmax(), out.shape))

# Display image
plt.imshow(img)
plt.title('Result (red marker on the detected location)')
plt.axis('off')

# Draw marker at detcted location
plt.plot(x, y, 'rx', ms=25, mew=5)
plt.show()
A solution is to normalize the pixels of the image and template at every step before comparing them. This is called normalized cross-correlation.
1つの解決法が、画像とテンプレを比較する前に、全ステップで画像とテンプレの画素を正規化することです。これを正規化相互相関と言います。
The mathematical definition for normalized cross-correlation of $f$ and template $g$ is:
画像$f$とテンプレ$g$の正規化相互相関に対する数学的定義:
$$(f\star{g})[m,n]=\sum_{i,j} \frac{f[i,j]-\overline{f_{m,n}}}{\sigma_{f_{m,n}}} \cdot \frac{g[i-m,j-n]-\overline{g}}{\sigma_g}$$
where:
- $f_{m,n}$ is the patch image at position $(m,n)$
- $f_{m,n}$は、ポジション$(m,n)$のパッチ画像
- $\overline{f_{m,n}}$ is the mean of the patch image $f_{m,n}$
- $\overline{f_{m,n}}$は、バッチ画像$f_{m,n}$の平均
- $\sigma_{f_{m,n}}$ is the standard deviation of the patch image $f_{m,n}$
- $\sigma_{f_{m,n}}$は、バッチ画像$f_{m,n}$の標準偏差
- $\overline{g}$ is the mean of the template $g$
- $\overline{g}$は、テンプレート$g$の平均
- $\sigma_g$ is the standard deviation of the template $g$
- $\sigma_g$は、テンプレート$g$の標準偏差
Implement normalized_cross_correlation function in filters.py and run the code below.
filters.pyにnormalized_cross_correlation関数を実装して下のコードを実行
from numba import njit
@njit(fastmath=True)
def normalized_cross_correlation(f, g):
    """ Normalized cross-correlation of f and g
    Normalize the subimage of f and the template g at each step
    before computing the weighted sum of the two.
    Args:
        f: numpy array of shape (Hf, Wf)
        g: numpy array of shape (Hg, Wg)
    Returns:
        out: numpy array of shape (Hf, Wf)
    """
    out = None
    ### YOUR CODE HERE
    Hg, Wg = g.shape
    Hf, Wf = f.shape
    out = np.zeros((Hf, Wf))
    norm_temp = (g-np.mean(g)) / np.std(g)
    m = int(Hg/2)
    n = int(Wg/2)
    for i in range(m,Hf-m):
        for j in range(n,Wf-n):
            patch_image =f[i-m:i+m, j-n:j+n+1]
            norm_patch_image = (patch_image-np.mean(patch_image)) \
               / np.std(patch_image)
            out[i][j] = np.sum(norm_temp * norm_patch_image)
    ### END YOUR CODE
    return out
from time import time
# Perform normalized cross-correlation between the image and the template
start = time()
out = normalized_cross_correlation(img_gray, temp_gray)

# Find the location with maximum similarity
y,x = (np.unravel_index(out.argmax(), out.shape))
end = time()
print("time took %f seconds." % (end - start))
# Display image
plt.imshow(img)
plt.title('Result (red marker on the detected location)')
plt.axis('off')

# Draw marker at detcted location
plt.plot(x, y, 'rx', ms=25, mew=5)
plt.show()
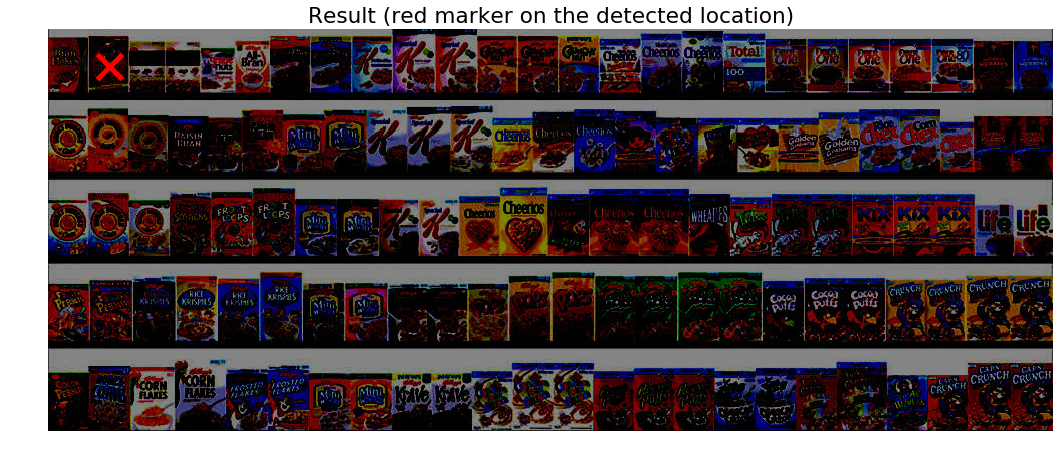
処理がとにかく重い。色々試したが、これ以上は速くなりそうにない。