前回のStanford University/CS131/宿題2-1の続きをやる。この宿題は、Canny edge detector(キャニーエッジ検出器)とHough transform(ハフ変換)をカバーする。今回は、二重しきい値とヒステリシスによるエッジ追跡を仕上げる。
Part 1: Canny Edge Detector
In this part, you are going to implment Canny edge detector. The Canny edge detection algorithm can be broken down in to five steps:
このパートでは、キャニー法を実装する。キャニーエッジ検出アルゴリズムは、5つのステップに分解することができる(今回は残りの2パート)。
- Double thresholding(二重閾値)
- Edge tracking by hysterisis(ヒステリシスによるエッジ追跡)
import numpy as np
import matplotlib.pyplot as plt
import matplotlib.image as mpimg
from time import time
from skimage import io
from __future__ import print_function
%matplotlib inline
plt.rcParams['figure.figsize'] = 18.0, 11.0 # set default size of plots
plt.rcParams["font.size"] = "18"
plt.rcParams['image.interpolation'] = 'nearest'
plt.rcParams['image.cmap'] = 'gray'
from edge import conv, gaussian_kernel

# Define 3x3 Gaussian kernel with std = 1
kernel = gaussian_kernel(3, 1)
kernel_test = np.array(
    [[ 0.05854983, 0.09653235, 0.05854983],
     [ 0.09653235, 0.15915494, 0.09653235],
     [ 0.05854983, 0.09653235, 0.05854983]]
)
# Test Gaussian kernel
if not np.allclose(kernel, kernel_test):
    print('Incorrect values! Please check your implementation.')
# Test with different kernel_size and sigma
kernel_size = 5
sigma = 1.4

# Load image
img = io.imread('iguana.png', as_gray=True)

# Define 5x5 Gaussian kernel with std = sigma
kernel = gaussian_kernel(kernel_size, sigma)

# Convolve image with kernel to achieve smoothed effect
smoothed = conv(img, kernel)
Double Thresholding
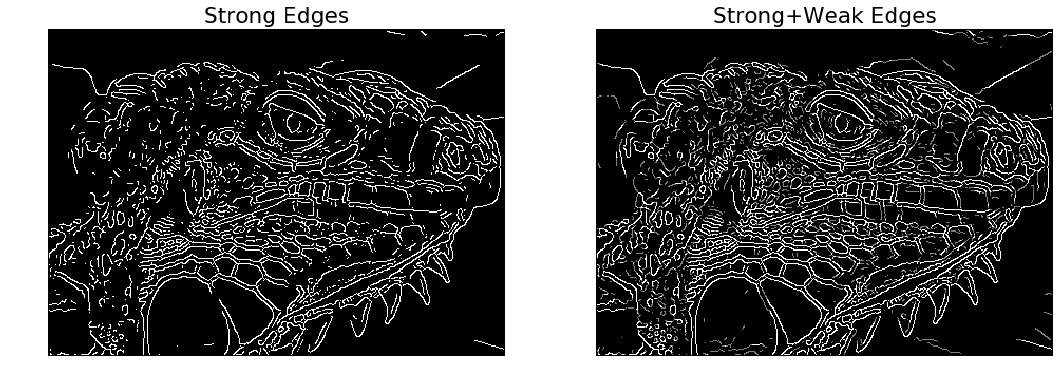
The edge-pixels remaining after the non-maximum suppression step are (still) marked with their strength pixel-by-pixel. Many of these will probably be true edges in the image, but some may be caused by noise or color variations, for instance, due to rough surfaces. The simplest way to discern between these would be to use a threshold, so that only edges stronger that a certain value would be preserved. The Canny edge detection algorithm uses double thresholding. Edge pixels stronger than the high threshold are marked as strong; edge pixels weaker than the low threshold are suppressed and edge pixels between the two thresholds are marked as weak.
非極大値抑制スッテプ後に残ったエッジ画素は、画素毎にそれらの強度によってマークが付与される。これらの多くが画像の真のエッジである可能性が高いが、幾つかは、ノイズや、粗い表面による色の変化に起因する可能性もある。真エッジと偽エッジの一番簡単な見分け方は閾値を使うことで、特定の値より強いエッジだけが保持される。キャニーエッジ検出アルゴリズムは二重しきい値を使用する。高閾値よりも強いエッジ画素は強とマークされ、低閾値よりも弱いエッジ画素は抑制されて、高閾値と低閾値と間のエッジ画素は弱マークが付けられる。
Implement double_thresholding in edge.py
edge.pyに、double_thresholdingを実装せよ。
def double_thresholding(img, high, low):
    """
    Args:
        img: numpy array of shape (H, W) representing NMS edge response
        high: high threshold(float) for strong edges
        low: low threshold(float) for weak edges
    Returns:
        strong_edges: Boolean array representing strong edges.
            Strong edeges are the pixels with the values above
            the higher threshold.
        weak_edges: Boolean array representing weak edges.
            Weak edges are the pixels with the values below the
            higher threshould and above the lower threshold.
    """
    strong_edges = np.zeros(img.shape)
    weak_edges = np.zeros(img.shape)
    ### YOUR CODE HERE
    strong_edges = img > high
    weak_edges = np.logical_and(img >= low, img <= high)
    ### END YOUR CODE
    return strong_edges, weak_edges
from edge import non_maximum_suppression
from edge import gradient

G, theta = gradient(smoothed)
nms = non_maximum_suppression(G, theta)
low_threshold = 0.02
high_threshold = 0.03

strong_edges, weak_edges = double_thresholding(nms, high_threshold, low_threshold)
assert(np.sum(strong_edges & weak_edges) == 0)

edges=strong_edges * 1.0 + weak_edges * 0.5

plt.subplot(1,2,1)
plt.imshow(strong_edges)
plt.title('Strong Edges')
plt.axis('off')

plt.subplot(1,2,2)
plt.imshow(edges)
plt.title('Strong+Weak Edges')
plt.axis('off')
plt.show()
Edge tracking
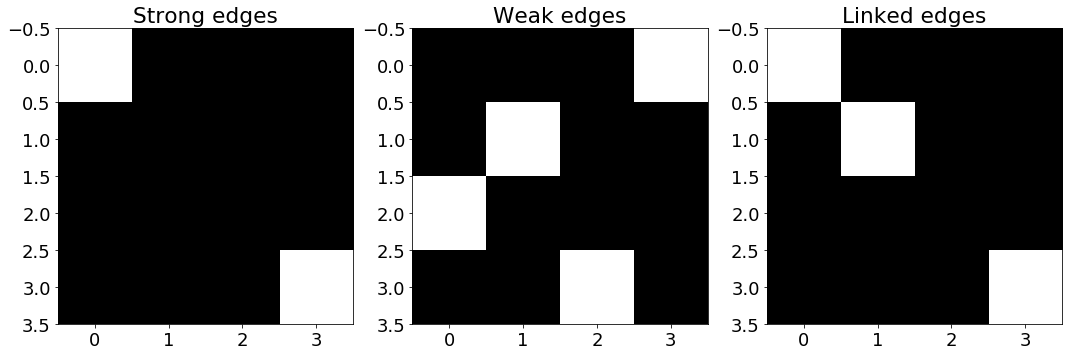
Strong edges are interpreted as “certain edges”, and can immediately be included in the final edge image. Weak edges are included if and only if they are connected to strong edges. The logic is of course that noise and other small variations are unlikely to result in a strong edge (with proper adjustment of the threshold levels). Thus strong edges will (almost) only be due to true edges in the original image. The weak edges can either be due to true edges or noise/color variations. The latter type will probably be distributed in dependently of edges on the entire image, and thus only a small amount will be located adjacent to strong edges. Weak edges due to true edges are much more likely to be connected directly to strong edges.
強いエッジは明白なエッジと解されて即座に最終エッジ画像に含まれる。弱いエッジは強いエッジと繋がっている場合だけ含まれる。もちろん、ノイズとその他の小さな変化は、(閾値の微調整で)強エッジに最終的にほとんど含まれない。従って、強エッジは原画像のほぼ本当のエッジのみによるものである。弱いエッジは、本当のエッジによるものか、ノイズ/色変化によるもののどちらかである。後者のタイプは、恐らく、全画像のエッジに依存して分布しているので、ほんの少量のエッジだけが強いエッジに連結して存在している。本当のエッジによる弱いエッジは、直接強いエッジと連結している可能性が非常に高い。
Implement link_edges in edge.py
edge.pyにlink_edgesを実装せよ。
def get_neighbors(y, x, H, W):
    """ Return indices of valid neighbors of (y, x)
    Return indices of all the valid neighbors of (y, x) in an array of
    shape (H, W). An index (i, j) of a valid neighbor should satisfy
    the following:
        1. i >= 0 and i < H
        2. j >= 0 and j < W
        3. (i, j) != (y, x)
    Args:
        y, x: location of the pixel
        H, W: size of the image
    Returns:
        neighbors: list of indices of neighboring pixels [(i, j)]
    """
    neighbors = []
    for i in (y-1, y, y+1):
        for j in (x-1, x, x+1):
            if i >= 0 and i < H and j >= 0 and j < W:
                if (i == y and j == x):
                    continue
                neighbors.append((i, j))
    return neighbors
def link_edges(strong_edges, weak_edges):
    """ Find weak edges connected to strong edges and link them.
    Iterate over each pixel in strong_edges and perform breadth first
    search across the connected pixels in weak_edges to link them.
    Here we consider a pixel (a, b) is connected to a pixel (c, d)
    if (a, b) is one of the eight neighboring pixels of (c, d).
    Args:
        strong_edges: binary image of shape (H, W)
        weak_edges: binary image of shape (H, W)
    Returns:
        edges: numpy array of shape(H, W)
    """
    H, W = strong_edges.shape
    indices = np.stack(np.nonzero(strong_edges)).T
    edges = np.zeros((H, W))
    ### YOUR CODE HERE
    edges = np.copy(strong_edges)
    for i in range(1, H-1):
        for j in range(1, W-1):
            neighbors = get_neighbors(j, i, H, W)
            if weak_edges[i,j] and np.any(edges[x,y] \
                                for x,y in neighbors):
                edges[i,j] = True
    ### END YOUR CODE
    return edges
test_strong = np.array(
    [[1, 0, 0, 0],
     [0, 0, 0, 0],
     [0, 0, 0, 0],
     [0, 0, 0, 1]]
)

test_weak = np.array(
    [[0, 0, 0, 1],
     [0, 1, 0, 0],
     [1, 0, 0, 0],
     [0, 0, 1, 0]]
)

test_linked = link_edges(test_strong, test_weak)

plt.subplot(1, 3, 1)
plt.imshow(test_strong)
plt.title('Strong edges')

plt.subplot(1, 3, 2)
plt.imshow(test_weak)
plt.title('Weak edges')

plt.subplot(1, 3, 3)
plt.imshow(test_linked)
plt.title('Linked edges')
plt.show()
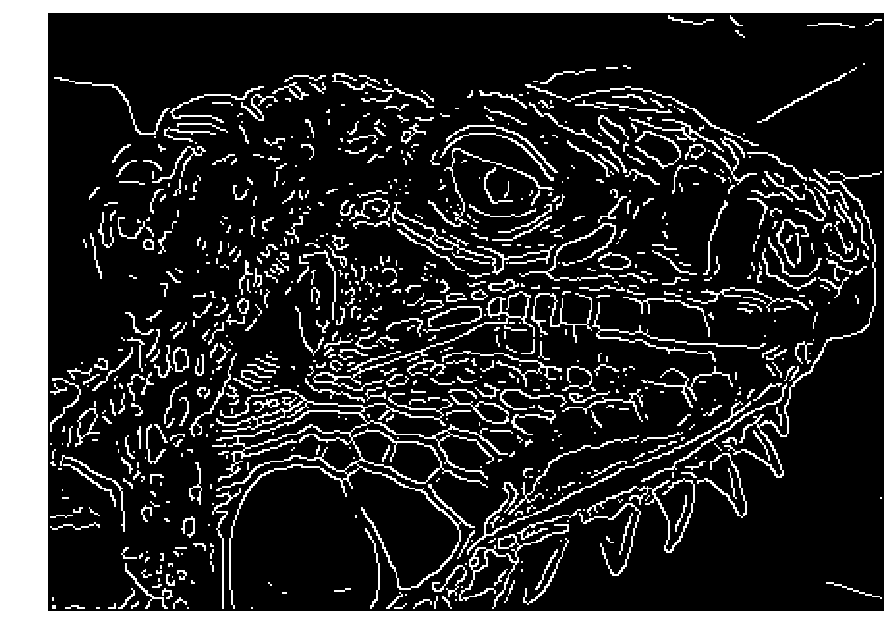
edges = link_edges(strong_edges, weak_edges)

plt.imshow(edges)
plt.axis('off')
plt.show()
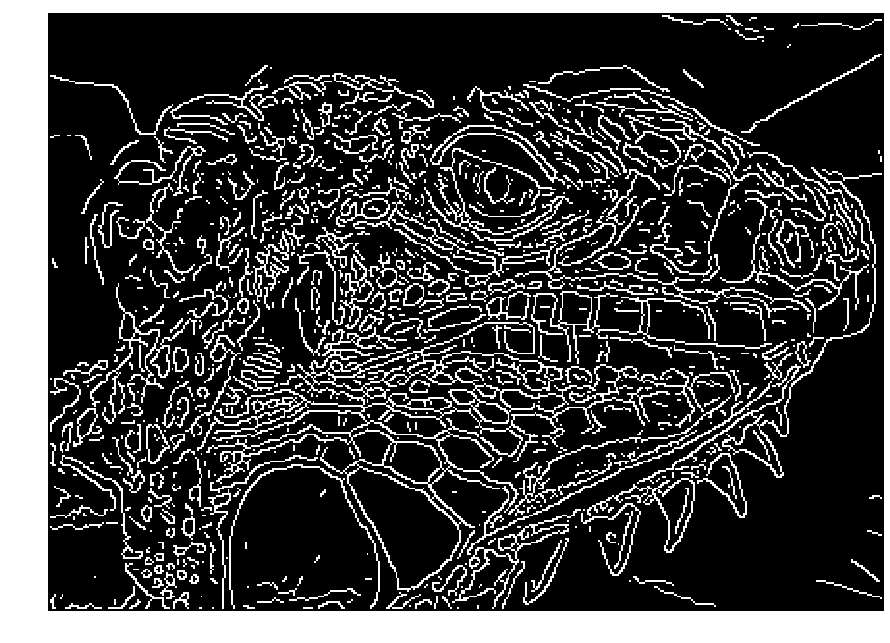
Canny edge detector
Implement canny in edge.py using the functions you have implemented so far. Test edge detector with different parameters.
今まで実装した関数を使用してedge.pyにcannyを実装せよ。異なるパラメーターを用いてエッジ検出器をテストする。
Here is an example of the output:
以下に出力例を示す。

def canny(img, kernel_size=5, sigma=1.4, high=20, low=15):
    """ Implement canny edge detector by calling functions above.
    Args:
        img: binary image of shape (H, W)
        kernel_size: int of size for kernel matrix
        sigma: float for calculating kernel
        high: high threshold for strong edges
        low: low threashold for weak edges
    Returns:
        edge: numpy array of shape(H, W)
    """
    ### YOUR CODE HERE
    kernel = gaussian_kernel(kernel_size, sigma)
    smoothed = conv(img, kernel)
    G, theta = gradient(smoothed)
    nms = non_maximum_suppression(G, theta)
    strong_edges, weak_edges = double_thresholding(nms, high, low)
    edge = link_edges(strong_edges, weak_edges)
    ### END YOUR CODE
    return edge
# Load image
img = io.imread('iguana.png', as_gray=True)

# Run Canny edge detector
edges = canny(img, kernel_size=5, sigma=1.6, high=0.06, low=0.025)
plt.imshow(edges)
plt.axis('off')
plt.show()