
pdfからデータを抽出して、世界に冠たる輸出大国日本の輸出貿易額をPythonを使ってグラフ化してみる。
import tabula

df = tabula.read_pdf("y4.pdf",
             output_format='dataframe',
             pages = '3',
             encoding='utf-8',
             java_options=None,
             pandas_options=None,
             multiple_tables=False)
# Read pdf into DataFrame
#tabula.convert_into("y4.pdf", "output.csv", output_format="csv", pages='1',encoding='')
df.head(10)
for i, col in enumerate(df.columns):
    df.iloc[:, i] = df.iloc[:, i].str.replace(',', '')
df.dropna(thresh=3,inplace=True)
df.reset_index(drop=True, inplace=True)
df = df.drop(['年'],axis=1)
df.head()
import tabula

df1 = tabula.read_pdf("y4.pdf",
             output_format='dataframe',
             pages = '2',
             encoding='utf-8',
             java_options=None,
             pandas_options=None,
             multiple_tables=False)

df1.head()
for i, col in enumerate(df1.columns):
    df1.iloc[:, i] = df1.iloc[:, i].str.replace(',', '')
df1.dropna(thresh=3,inplace=True)
df1.reset_index(drop=True, inplace=True)
df1 = df1.drop(['年'],axis=1)
df1.head()
import tabula

df2 = tabula.read_pdf("y4.pdf",
             output_format='dataframe',
             pages = '1',
             encoding='utf-8',
             java_options=None,
             pandas_options=None,
             multiple_tables=False)

df2.head()
for i, col in enumerate(df2.columns):
    df2.iloc[:, i] = df2.iloc[:, i].str.replace(',', '')
df2.dropna(thresh=3,inplace=True)
df2.reset_index(drop=True, inplace=True)
df2.head()
df3 = pd.concat([df2, df1, df], axis=1)
df3.head()
for i, col in enumerate(df3.columns):
    df3.iloc[:, i] = df3.iloc[:, i].str.replace(r"\(.*\)","")
df3.head()
for i, col in enumerate(df3.columns):
    df3.iloc[:, i] = df3.iloc[:, i].str.replace('億円', '')
df3.head()
df4 = df3[1:21][0:][::2].drop(['年'],axis=1)
df5 = df3[1:21][1:][::2].drop(['年'],axis=1)
a=[]
c=[]
for i, col in enumerate(df4.columns):
    b=list(df4.iloc[:, i].values)
    a.append(b)
for i, col in enumerate(df5.columns):
    d=list(df5.iloc[:, i].values)
    c.append(d)
e=[]
for i in range(24):
    f=list(zip(a[i],c[i]))
    e.append(f)
df7=pd.DataFrame(e[0])
df7.columns = ['Country', 'trade_value']
df7
df7.dtypes
df7["trade_value"] = pd.to_numeric(df7["trade_value"])
df7.dtypes
from matplotlib.pyplot import *
from matplotlib.font_manager import FontProperties
from matplotlib import rcParams

rcParams["font.size"] = "22"
fp = FontProperties(fname='/usr/share/fonts/opentype/ipaexfont-gothic/ipaexg.ttf', size=54)
rcParams['font.family'] = fp.get_name()

fig, ax = subplots(figsize=(20,12))
df7.plot(ax=ax,x='Country',kind='barh',)
xticks(np.arange(0, 14e4, 1e4),
           ['{}兆'.format(int(x / 1e4)) if x > 0 else 0 for x in np.arange(0, 14e4, 1e4)])
ax.legend(["輸出額"],loc='lower right', prop={'size': 26})
for i in ax.patches:
    ax.text(i.get_width()+1e3,i.get_y()+.38,\
      str(round((i.get_width()),1)),fontsize=22,fontname='Arial',color='dimgrey',fontweight='bold')
ax.invert_yaxis()
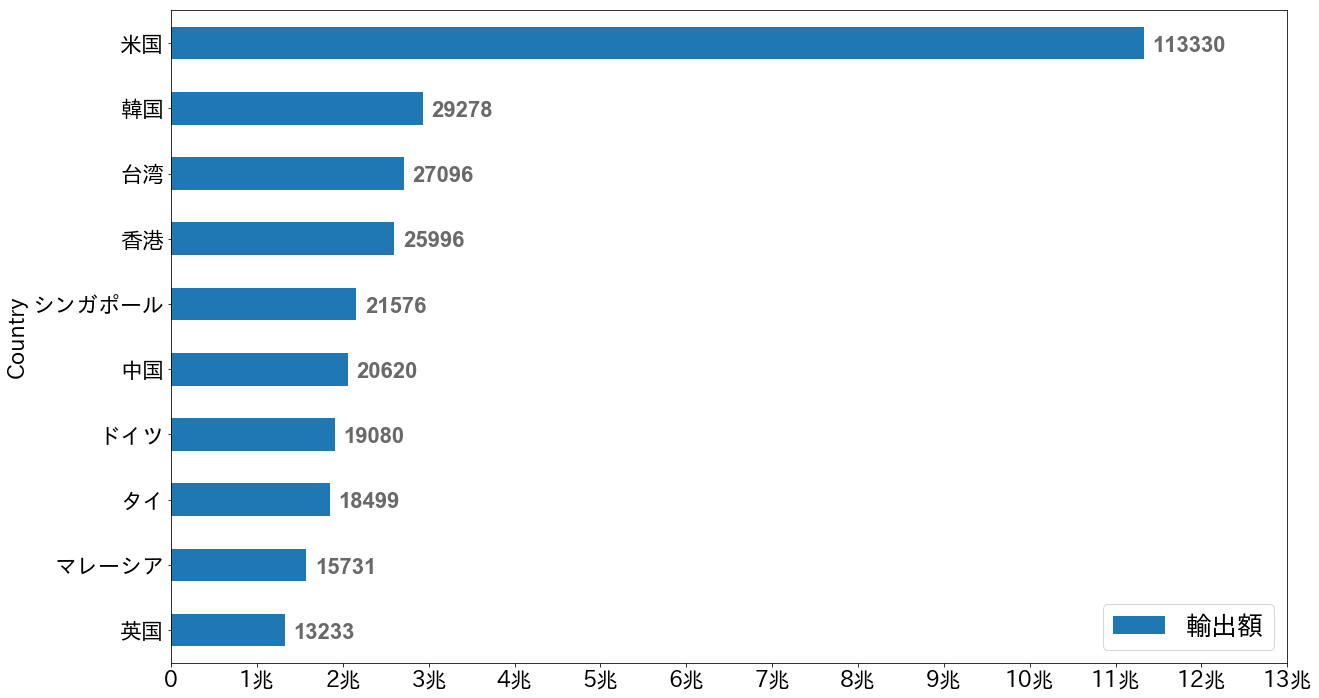
df3[:1]
1995年の輸出額総額が41兆5309億円なので、米国への輸出額は日本の輸出総額の27.3%だった。
df8=[]
for i in range(24):
    m=pd.DataFrame(e[i])
    m.columns = ['Country', 'trade_value']
    m["trade_value"] = pd.to_numeric(m["trade_value"])
    df8.append(m)
df8[20].dtypes
fig, ax = subplots(figsize=(20,12))
df8[23].plot(ax=ax,x='Country',kind='barh',)
xticks(np.arange(0, 19e4, 1e4),
           ['{}兆'.format(int(x / 1e4)) if x > 0 else 0 for x in np.arange(0, 19e4, 1e4)])
ax.legend(["輸出額"],loc='lower right', prop={'size': 26})
for i in ax.patches:
    ax.text(i.get_width()+1e3,i.get_y()+.38,\
      str(round((i.get_width()),1)),fontsize=22,fontname='Arial',color='dimgrey',fontweight='bold')
ax.invert_yaxis()
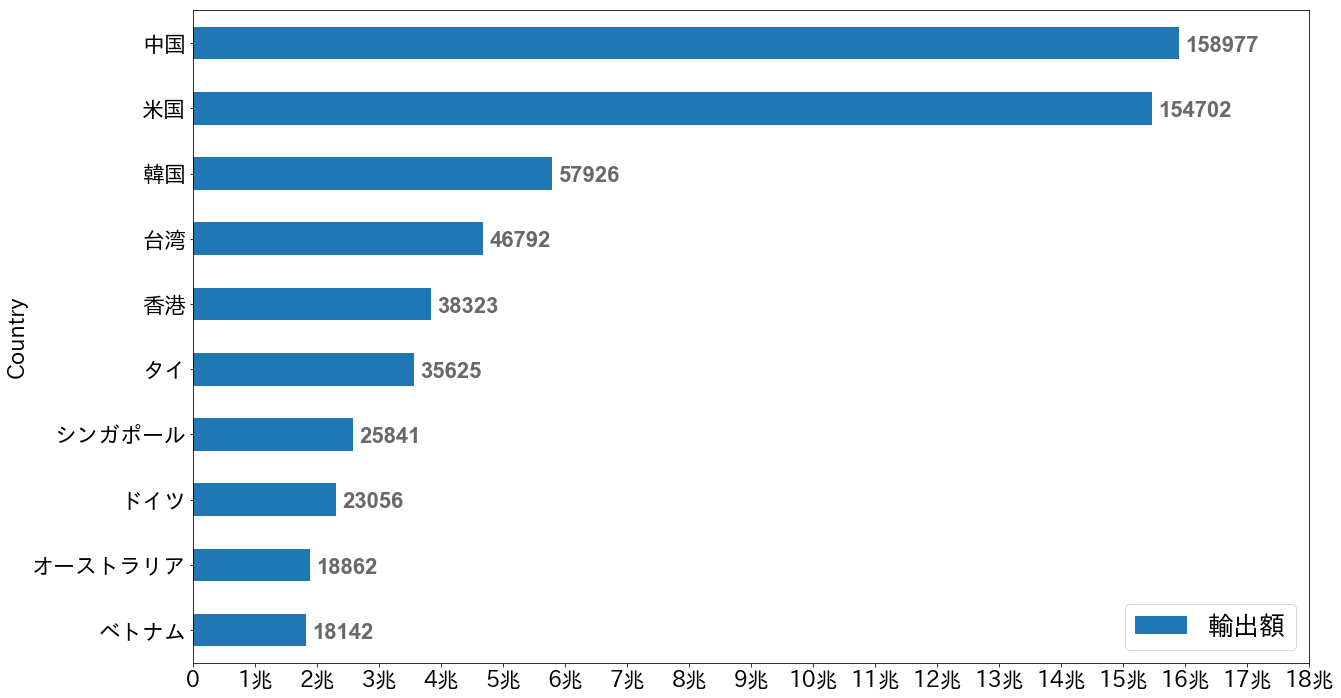
2018年になると中国が最大の輸出相手国になっている。1995年には2兆円程度だった輸出額が去年は約16兆円まで膨れ上がっている。台湾、香港、中国の中華経済圏だけで、日本の総輸出額の3割を占める24兆4000億円である。外需の中国依存が鮮明化しているだけではなく、内需も中国人観光客に支えられている部分があるので、まさに中国様様である。
スポンサーリンク